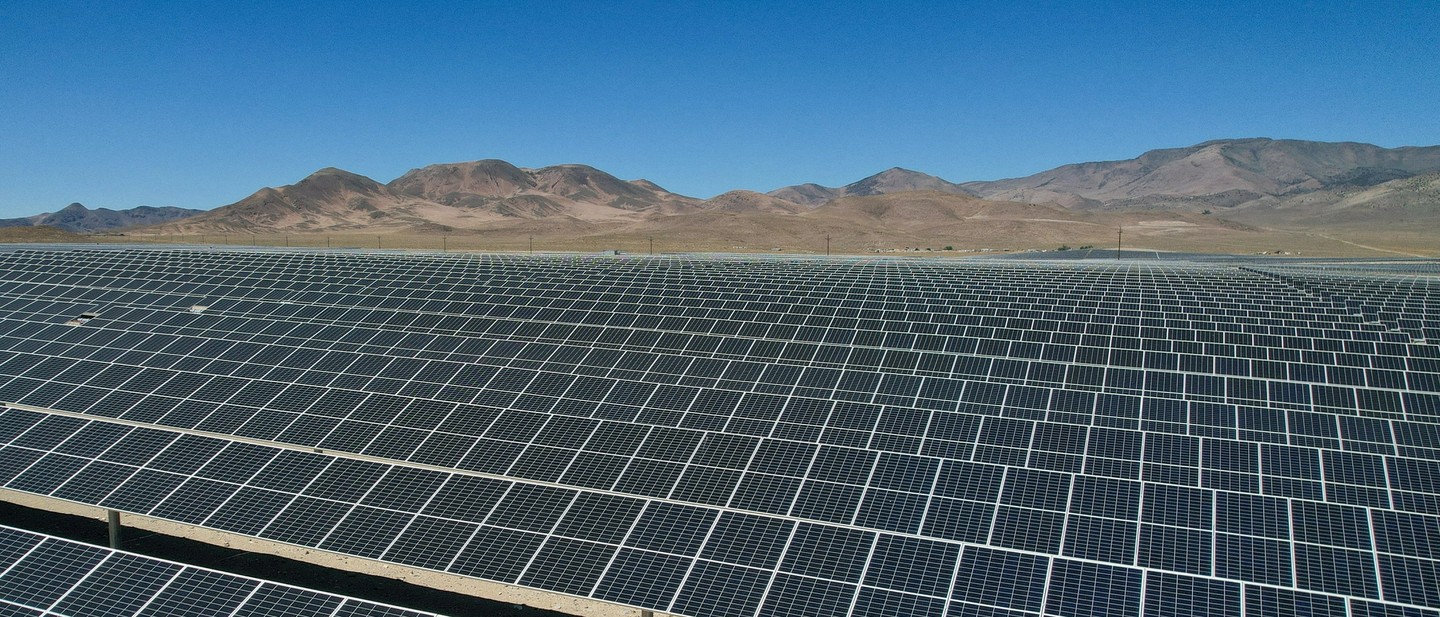
Utility-Scale Solar Cost Per MW 2026: EPC Bid Guide
What Shapes the Utility‑Scale Solar Cost Figure
Utility‑scale solar farm cost per megawatt (MW) is the sum of all expenditures required to bring a project from ground‑zero to commercial operation. CAPEX (capital expenditures) is expressed as $/MW or $/W installed. Lazard's 2026 LCOE+ report puts unsubsidized utility-scale solar capital cost at $1.25 M to $1.85 M per MW in the US, up from prior years. Outside the US, the number looks very different: Indian utility-scale solar EPC pricing runs closer to $370,000 to $490,000 per MW (roughly INR 3.1 to 4.2 crore per MW), a quarter of the US figure. Quoting one global range without a region attached is the single most common way EPCs mis-set client expectations. LCOE (levelized cost of energy) is expressed as $/MWh over the project life and reflects operating costs, financing, and discounting. The major cost blocks are:
- Solar modules and balance‑of‑system (BOS). Modules dominate the equipment bill, while inverters, mounting structures, wiring, and grid‑interconnection hardware complete the BOS.
- Site acquisition and civil works. Land purchase or lease, grading, access roads, fencing, and drainage fall into this category.
- EPC services and project management. Engineering design, procurement, construction, commissioning, and quality‑assurance activities are bundled here.
- Financing and soft costs. Interest during construction, legal fees, permitting, insurance, and tax‑equity structures form the financing layer.
EPC’s focus: Isolate each driver in a spreadsheet model, assign region‑specific unit costs, and run sensitivity scenarios on financing terms – this prevents hidden overruns later.
Lazard's 2026 LCOE+ report (19th edition, released July 2026) still finds unsubsidized utility-scale solar the cheapest new-build generation source on a $/MWh basis, at $40 to $98/MWh against $51 to $129/MWh for new gas combined-cycle plants. But the report's own framing has shifted: it's now describing a market where every generation technology faces rising costs, and solar's advantage is relative, not absolute. That distinction matters when a client asks why their quote went up from last year's number.
This is a reversal, not a continuation. Lazard's data goes back to 2009, and on that long view utility-scale solar LCOE is down 81%. But since 2021, it has risen 85%, a 12% compound annual increase, and Lazard's 2026 edition is explicit that this year's rise reflects higher capital costs, sustained interest rates, tariff pass-through and supply chain repricing, not a blip. EPCs still pricing off a 2022 or 2023 benchmark are quoting stale numbers. If your last cost model predates mid-2026, rebuild it before your next bid.

The IRENA 2023 renewable power generation cost report expands on this trend, highlighting that global weighted‑average capital costs for utility‑scale solar have fallen consistently over the past five years, driven primarily by module‑price reductions and improvements in supply‑chain efficiency. The report also points out that regions with emerging manufacturing capacity, such as South‑East Asia, are seeing faster cost declines than markets reliant on imports, a nuance that EPCs must factor into regional cost multipliers.
Regional and Scale Variation in Costs
Even though the cost structure is universal, regional factors cause wide variation in the final $/MW figure:
North America (U.S. and Canada)
- Strong manufacturing base reduces module costs, but labor rates and permitting timelines can raise soft‑cost percentages.
- Land cost varies dramatically, from inexpensive desert sites in the Southwest to pricier reclaimed industrial parcels in the Midwest.
Europe
- Higher labor and regulatory costs increase EPC service fees.
- Aggressive auction pricing in markets such as Spain and Germany compresses overall CAPEX, offsetting softer land costs.
Asia‑Pacific (India, China, Australia)
- Module cost advantages from local manufacturers drive down equipment spend.
- Land acquisition and grid‑connection fees are the dominant cost drivers in densely populated regions.
Africa (e.g., Senegal)
- IEA’s Senegal case study highlights that “attractive investment propositions” stem from low‑cost land and favourable tax regimes, though higher logistics costs for importing BOS components can raise total spend.
Scale also matters: projects larger than 500 MW benefit from economies of scale in procurement and construction, typically achieving lower $/MW than smaller 50 MW sites. However, beyond a certain size, logistics and transmission upgrades can erode those gains.
How EPCs Use Cost Benchmarks in Proposals
EPCs translate the generic cost blocks into project‑specific proposals by:
- Benchmark CAPEX against installed-cost data and local EPC quotes, and use Lazard-style LCOE only for lifetime $/MWh comparisons.
- Applying regional cost multipliers. Adjust base‑case unit costs for local labor rates, land prices, and import duties.
- Running financing scenarios. IEA’s 2022 cost‑of‑capital data show that the weighted average cost of capital (WACC) for utility‑scale solar projects typically ranges between 4 % and 8 % depending on market risk perception.
- Embedding contingency and risk buffers. EPCs add a contingency line (often 5‑10 % of total CAPEX) to cover unforeseen site conditions, permitting delays, or commodity price swings.
Practical tip: Align your cost model with the same assumptions used by Lazard (e.g., 30‑year plant life) to ensure comparability when clients evaluate bids.
Why Global Benchmarks Don't Match Your Bid
Lazard's $69/MWh average utility-scale solar LCOE is built on one illustrative project: 300 MW, 55% capacity factor, 60% debt at 8% interest, 40% equity at 12% cost, US market. NREL and IRENA use their own equally specific assumption sets. None of them are wrong, but none of them are your project either. Three places top-down and bottom-up numbers diverge in practice:
- Capital structure: A 20 MW India project financed through a mix of promoter equity and a domestic term loan does not carry Lazard's assumed 60/40 US-market debt-equity split or its interest rate. Run your own WACC, not the benchmark's.
- Scale: Lazard models a 300 MW greenfield project. A 20 MW or 50 MW project does not get the same procurement leverage on modules, inverters, or EPC labor. Smaller projects should expect a higher $/MW than the headline benchmark, not the same one.
- Region: A global or US-weighted average tells you nothing about India, Southeast Asia, or the Middle East, where labor costs, import duties, module sourcing, and land prices move the number by 2 to 3x.
How to use the benchmark correctly. treat Lazard, NREL and IRENA as a sanity-check ceiling and floor for your assumptions, not as an input to the bid itself. If your vendor quotes land 40% below the benchmark, that's a reason to check module tier and warranty terms, not a reason to celebrate a great price.
Common Estimation Mistakes EPCs Must Avoid
Even seasoned EPCs fall into traps that inflate the cost per MW:
- Under‑estimating land acquisition. Assuming nominal lease rates without accounting for site‑specific access or environmental mitigation can add 10‑20 % to soft costs.
- Ignoring local tax incentives or subsidies. Many jurisdictions offer accelerated depreciation or production‑based incentives that, if omitted, overstate net cost.
- Over‑simplifying financing inputs. Using a single WACC figure for all markets ignores sovereign risk premiums; IEA’s 2022 data illustrate a spread of up to 4 % between low‑risk and emerging‑market projects.
- Failing to capture O&M escalation. Operations‑and‑maintenance expenses grow over a plant’s lifetime; ignoring escalation leads to an optimistic LCOE and can hurt long‑term profitability.
Reslink’s project‑documentation module lets EPCs embed the latest regional cost multipliers directly into proposal templates, reducing manual errors and ensuring every bid reflects current market data.
Action Checklist – What EPCs Must Do Now
- Gather latest benchmark data. Download Lazard’s 2025 LCOE+ and IRENA’s 2023 cost reports; note equipment price trends.
- Map regional cost drivers. Create a spreadsheet of land, labor, and import duty factors for each target market.
- Model financing scenarios. Use IEA’s 2022 cost‑of‑capital chart to set market‑specific WACC ranges.
- Incorporate local incentives. Research tax credits, accelerated depreciation, and renewable‑energy certificates in each jurisdiction.
- Validate with a pilot model. Run a “small‑scale” version of the cost model for a 50 MW site before scaling to larger projects.
Supporting Information
Equipment Cost Trends
- Modules and BOS components continue to decline in price, as noted by Lazard’s analysis.
- IRENA’s 2023 report adds that improved wafer yields and the wider adoption of bifacial modules have contributed to the equipment cost curve flattening, especially in markets where local manufacturers have adopted these technologies. This provides EPCs with a strategic lever: specifying newer module technologies can lock in lower long‑term operating costs even if upfront prices are marginally higher.
Financing Landscape
- IEA’s 2022 cost‑of‑capital chart shows median WACC values: 4.5 % for the United States, 5.2 % for Europe, and 7.0 % for emerging markets in Africa and Latin America.
Regulatory Context
- No universal regulatory threshold governs utility‑scale solar cost per MW; each country sets its own grid‑interconnection standards and land‑use policies. EPCs must consult the national utility or regulator (e.g., India’s Central Electricity Authority, USA’s FERC) for project‑specific requirements.
Frequently Asked Questions
Q1. How does the 2025 Lazard LCOE+ report influence utility‑scale solar cost estimates?
Lazard’s LCOE+ analysis shows that, on an unsubsidized $/MWh basis, solar remains the cheapest generation option worldwide. EPCs should not use a generic 20% discount rate as a universal Lazard assumption for cost-per-MW models. Use project-specific WACC/discount-rate assumptions and keep them separate from installed CAPEX.
Q2. Why do industry reports say solar costs are falling when my EPC quotes keep rising?
They stopped saying that in 2026. Lazard's most recent report shows utility-scale solar LCOE up 85% since 2021, driven by capital costs, interest rates, tariffs and supply chain repricing. The "costs always fall" framing reflects the 2009-2021 period, not the current one. If a client pushes back on a quote citing an older article, the correct response is that the benchmark itself has moved, not that your pricing is out of line.
Q3. What regional cost multiplier should I apply for land in desert versus suburban sites?
Desert land typically costs 30‑50 % less per acre than suburban or industrial sites. However, the exact multiplier depends on local permitting fees and infrastructure proximity. EPCs should source actual land‑price data from regional real‑estate reports or government cadastral databases.
Q4. How does the cost of capital affect the overall $/MW figure?
A higher weighted average cost of capital (WACC) raises the discounted cash‑flow cost of capital, which translates into a higher levelized cost and a larger financing component in the capex model. IEA’s 2022 data illustrate WACC ranges from 4 % in low‑risk markets to 8 % in higher‑risk regions, directly impacting the total $/MW when financing makes up 20‑30 % of total project cost.
Q5. Are there any global subsidies that still affect utility‑scale solar cost per MW in 2026?
Many countries maintain production‑based incentives (e.g., India’s Renewable Energy Certificates) or capital‑cost subsidies. While the Lazard report indicates renewables are competitive without subsidies, EPCs must still account for any local incentive that reduces net cost for the project owner, as ignoring them can inflate the reported $/MW.
Q6. What typical contingency percentage should I include in a cost model?
Industry practice commonly adds a 5‑10 % contingency to total CAPEX to cover unforeseen site conditions, permitting delays, or commodity price spikes. The exact figure depends on project complexity and local risk exposure.
Q7. How do I incorporate operations‑and‑maintenance (O&M) escalation into the cost per MW?
Project O&M costs generally rise 2‑3 % annually due to inflation and component wear. EPCs should model this escalation over the plant’s expected 25‑30 year life and reflect the present‑value impact in the LCOE calculation.
Q8. Can I rely solely on global benchmarks for a project in a developing market?
Global benchmarks provide a useful starting point, but local factors, such as import duties, labor skill levels, and grid‑interconnection fees, often cause significant deviations. EPCs should adjust the global base with market‑specific data to avoid under‑ or over‑pricing.
Q9. What role does storage play in utility‑scale solar cost calculations?
When paired with battery storage, the overall $/MW rises due to battery capital cost and additional balance‑of‑system components. The impact depends on battery duration, power rating, chemistry, power conversion system (PCS), grid interconnection requirements, land needs, and market conditions. EPCs should state these assumptions before quoting any percentage increase.
Q10. How frequently should I update my cost model?
Given rapid equipment price changes and evolving financing conditions, EPCs should refresh cost inputs at least annually, or whenever a major market shift (e.g., new subsidy, tariff change) occurs. Align updates with the release cycles of Lazard’s LCOE+ and IRENA’s renewable cost reports.
Q11. How do currency fluctuations impact the $/MW estimate for imported equipment?
IRENA’s 2023 cost report notes that exchange‑rate volatility can materially affect the landed cost of imported modules and inverters, especially for projects in emerging markets that rely on dollar‑priced imports. EPCs should incorporate a sensitivity band for currency swings in their financial model and, where possible, secure forward contracts or local sourcing to mitigate exposure.
Q12. What documentation is typically required during the permitting stage, and how does it affect cost estimates?
The NREL Utility‑Scale Solar Cost Baseline outlines that permitting packages commonly include environmental impact assessments, grid interconnection studies, and land‑use approvals. Each document must meet the standards of the national regulator, and delays in securing approvals can extend the construction schedule, increasing interest‑during‑construction costs. EPCs should factor a realistic permitting timeline into their cost model to avoid under‑budgeting for soft costs and financing overruns.
Sources
- International Renewable Energy Agency (IRENA), Renewable Power Generation Costs in 2023, https://www.irena.org/-/media/Files/IRENA/Agency/Publication/2024/Sep/IRENA_Renewable_power_generation_costs_in_2023.pdf – referenced for global cost‑trend context and currency‑risk comment.
- International Energy Agency (IEA), Cost of Capital for Utility‑Scale Solar PV and Storage Projects Taking Final Investment Decision in 2022, https://www.iea.org/data-and-statistics/charts/cost-of-capital-for-utility-scale-solar-pv-and-storage-projects-taking-final-investment-decision-in-2022 – provides WACC ranges by region.
- IEA, Senegal Case Study – Utility‑Scale Solar PV and Wind in Senegal, https://www.iea.org/reports/senegal-case-study/utility-scale-solar-pv-and-wind-in-senegal-overcoming-regional-related-risk-perceptions-with-an-attractive-investment-proposition – supports regional cost insights for West Africa.
- National Renewable Energy Laboratory (NREL), Utility‑Scale Solar Cost Baseline, https://www.nrel.gov/docs/fy19osti/71814.pdf – foundational cost‑component breakdown used for generic cost‑driver description and permitting documentation detail.
Related Articles

Solar & Storage Live UK 2026: EPC Guide
NEC Birmingham, September 22-24. Confirmed speakers, six conference tracks, and the live grid-connection fight EPCs should actually watch.

Solar Design Software for EPCs in Botswana
Botswana's Rooftop Solar Programme runs through BPC. What EPCs need for compliance, and how Reslink fits a market just getting started.
US Energy Storage Hits Record 20.2 GWh in Q2 2026
US energy storage hit a record 20.2 GWh in Q2 2026, 44% paired with solar. What the SEIA/Benchmark data signals for solar EPCs globally.