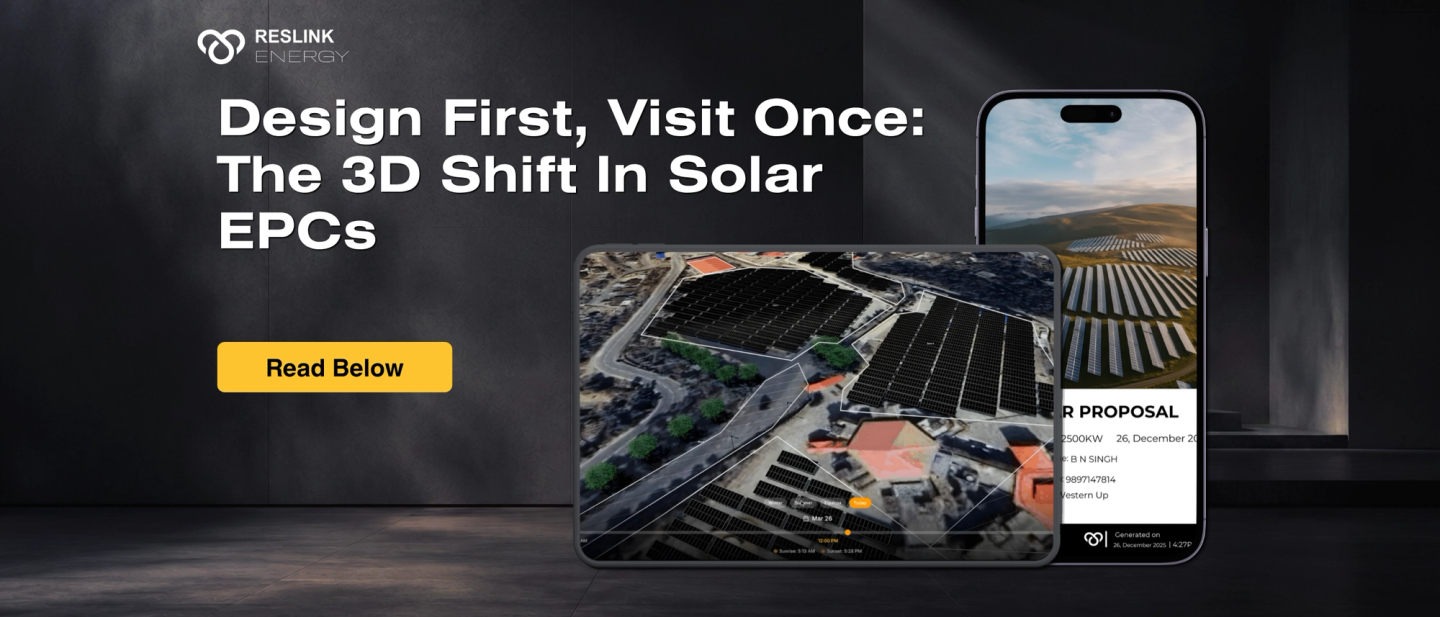
Design First, Visit Once: The 3D Shift in Solar EPCs
If your EPC is still running two or three site visits per project before the first panel goes up, the workflow problem is not the site itself. It is the design tool. This blog covers exactly how 3D solar design software changes the workflow, what drives the accuracy improvement, and what to look for in a platform built for Indian conditions rather than adapted from international markets.
The Site Visit Problem Most EPCs Have Accepted as Normal
A typical residential solar project in India follows a workflow most EPCs have never stopped to question. The first visit collects roof measurements and assesses site conditions. The team returns to the office to draft the layout and write the proposal. One or two more visits verify conditions before installation begins. By the time the first panel is mounted, the team has spent three to six hours per project moving between office and site.
The cumulative cost is significant. For an EPC running 50 residential projects per year, that overhead adds up to 15 to 20 lakh rupees in annual labour before any panels are installed or revenue collected. At 100 projects per year, the figure doubles.
In a market where India needs thousands of residential installations per day to hit its solar targets, and where the difference between an EPC processing five projects per week and one processing ten is almost entirely a workflow question, that overhead is the primary constraint on monthly revenue, not the size of the sales team.
How 3D Solar PV Design Changes the Workflow
3D solar design software uses satellite imagery to build a preliminary model of the target rooftop without anyone visiting the site first. The solar PV design workflow starts with the satellite image of the roof, on which the salesperson draws the usable roof area and places panels in the configured layout. The tool assigns the string and inverter configuration, then calculates shade impact from every obstruction on the roof — parapets, water tanks, staircase access points, and surrounding structures — at every hour of the day across all twelve months.
The output is a complete proposed panel layout with a yield estimate that accounts for the roof's specific orientation, local solar irradiance data, the detailed shade profile, and system losses from the inverter to the meter. When produced by a calibrated tool with accurate irradiance data and current panel datasheets, this yield estimate is accurate enough for a complete customer proposal and bank submission.
The single site visit that remains after the remote design phase is a verification step, not a data collection step. The EPC already knows the panel layout, inverter location, and cable routing before anyone drives to the site. The visit confirms that the 3D model matches physical conditions, checks the roof's structural state, and identifies the net metering connection point for the DISCOM. It takes 20 to 30 minutes rather than 90 to 120 minutes.
For a salesperson running five to eight site visits per day, the difference between a 30-minute verification and a 120-minute data collection visit changes how many projects can be moved from conversation to proposal in a single day. That pipeline velocity compounds across every working day of the year.
The Accuracy Improvement That Directly Protects Margin
The financial case for 3D design tools goes beyond saved travel time. Manual solar designs that do not model shade precisely systematically overestimate energy production. On-site visual assessments underestimate the cumulative performance impact of partial shading on string output across a full year, particularly at string level where a single shaded cell affects the output of the entire string through the inverter MPPT.
When a system's actual first-year generation comes in 12% below the proposal's yield estimate, the client notices immediately. The EPC's credibility with that client, and with any referrals from that client, takes a direct hit. In a segment driven almost entirely by word-of-mouth referrals and community trust, a yield shortfall is a customer retention problem that compounds.
Tools that accurately model shade from the roof's own obstructions, from surrounding structures, and from seasonal sun angle changes produce yield estimates that match installed performance closely. EPCs using well-calibrated 3D solar design tools report actual first-year generation within 3 to 5% of the modelled figure, compared to variances of 10 to 15% with manual approaches. That accuracy gap directly protects the EPC's margin, yield guarantee commitments, and client retention rate.

What India-Specific Solar PV Design Software Actually Covers
Not every solar design tool available in India was built for Indian conditions. Platforms adapted from the US or European market require manual workarounds that add time and risk to every project. Four capabilities define a solar design platform that works without workarounds for Indian EPCs.
Automated BOM calculation
Beyond simulation and compliance, Indian EPCs need the design tool to automatically generate the full Bills of Material (BOM). This covers both the Bills of Electrical, which lists every electrical component from cables and inverters to distribution boards, and Bills of Structure, covering mounting rails, clamps, and fasteners, all calculated from the actual 3D panel layout.
Manual BOM preparation in Excel after every design revision adds hours per project and introduces procurement errors. A cable quantity estimated incorrectly, or a mounting component count that does not match the final panel configuration, surfaces as an error at the installation stage after materials are already on-site.
Reslink generates the complete BOM automatically from the 3D model. When the design changes, the BOM updates. The procurement team receives an accurate, design-matched material list without a separate calculation exercise.
DISCOM-compliant SLD generation
Indian DISCOMs require the Single Line Diagram in a format that differs from US NEC and European electrical drawing standards. A solar design tool that generates SLD only in an international format requires additional reformatting work for every project that needs grid connection or bank financing, typically adding 2 to 3 hours of internal effort per commercial project.
Reslink generates the SLD natively in DISCOM-accepted format from the same 3D design. The layout drawing and string drawing generate alongside it. That 2 to 3 hours of additional work per project disappears. The document is ready before the salesperson leaves the site.
Real-time ALMM compliance
MNRE's ALMM mandate is enforced for all grid-connected solar installations in India. A solar design tool that does not check equipment compliance at the selection stage allows non-ALMM panels and inverters to reach the proposal and procurement stages. The compliance error surfaces at DISCOM inspection after installation is complete, triggering reinspection fees, idle crew days, and forced re-procurement at short notice.
Reslink checks every panel and inverter against the current ALMM approved list in real time at equipment selection. Non-compliant equipment is flagged before the design is finalised. A failed DISCOM inspection from equipment non-compliance becomes preventable at source.
India-specific financial modelling
A solar design tool for Indian EPCs needs to calculate PM Surya Ghar subsidy automatically by system size, handle accelerated depreciation for commercial projects, and compare system output against actual state DISCOM tariff orders. International platforms leave all three to manual configuration per project and per state.
Reslink handles all three natively. PM Surya Ghar subsidy calculates automatically from system size. The correct slab appears in every residential CAPEX proposal without manual input. DISCOM tariff comparisons apply from the project's state, not from a generic default.
Why Reslink Is the Right Solar PV Design Platform for Indian EPCs
Reslink is the world's first mobile-first 3D solar PV design platform and the best solar design software for EPCs in India. The complete workflow runs on any device.
From a single satellite-based 3D design, Reslink generates:
- CAPEX and OPEX proposals with yield simulation, shadow analysis, rupee ROI, and PM Surya Ghar subsidy
- Automated Bills of Material (BOM) calculation, covering Bills of Electrical and Bills of Structure, generated directly from the 3D model
- Bank-ready SLD, layout drawing, and string drawing in DISCOM-accepted format
- Real-time ALMM compliance check at equipment selection
- WhatsApp proposal delivery from inside the platform
The salesperson completes the full design, runs the shadow simulation, and delivers the proposal to the customer over WhatsApp before leaving the roof. The entire workflow takes under 10 minutes from a completed 3D design. 4,500+ solar EPC companies across residential, C&I, open access, and utility-scale projects use Reslink from 3 kW to 1 GW.

Frequently Asked Questions
Q1. What is 3D solar PV design software and how does it work?
3D solar PV design software builds a model of the target rooftop using satellite imagery, places panels on the model, configures the string and inverter layout, and calculates shade impact from every obstruction across every hour of the year. The output is a yield estimate accurate enough for a customer proposal and a bank-ready document package, without anyone visiting the site first. Reslink completes this full design workflow in under 10 minutes from a phone.
Q2. Can I use Reslink for solar PV design on mobile, not just desktop?
Yes. Reslink is the world's first mobile-first 3D solar PV design platform. The complete workflow — satellite-based 3D design, shadow simulation, ALMM compliance check, CAPEX and OPEX proposal generation, and WhatsApp delivery — runs on any device including phones and tablets. A salesperson can complete the full design and deliver a proposal to the customer before leaving the site, without going back to the office.
Q3. How accurate are 3D PV solar design yield estimates compared to manual calculations?
3D solar design tools that accurately model shade from roof obstructions, surrounding structures, and seasonal sun angle changes produce yield estimates within 3 to 5% of installed performance. Manual solar designs that estimate shade visually typically show variances of 10 to 15% against actual first-year generation. The accuracy difference directly impacts client trust, yield guarantee commitments, and repeat business when the first electricity bill arrives.
Q4. Does Reslink generate DISCOM-compliant SLDs for Indian solar projects?
Yes. Reslink generates the Single Line Diagram in the format accepted by Indian DISCOMs, directly from the 3D design. The output meets the standards required for both grid connection applications and project financing, without any reformatting. This eliminates 2 to 3 hours of additional internal work per commercial project and ensures the document is ready before the salesperson leaves the site.
Q5. How does Reslink handle ALMM compliance during solar PV design?
Reslink checks every panel and inverter selection against the MNRE ALMM approved list in real time at the equipment selection stage. If a product is not on the current list, the platform flags it before the design is finalised. This prevents DISCOM rejection at the inspection stage — reinspection fees, idle crew days, and expedited re-procurement — by catching the compliance issue at source before any procurement happens.
Q6. What is the cost saving from switching to 3D solar PV design software?
Bills of Material (BOM) is the complete material list for a solar installation, covering both Bills of Electrical — cables, inverters, distribution boards — and Bills of Structure, including mounting rails, clamps, and fasteners. Manual BOM preparation in Excel after every design adds hours per project and introduces procurement errors. Reslink generates the full BOM automatically from the 3D model, updating whenever the design changes, with no separate calculation required.
Q7. Does Reslink work for commercial and utility-scale solar PV design, not just residential?
Yes. Reslink handles projects from 3 kW residential to 1 GW utility-scale on the same platform. BOM calculation, bank-ready SLD, and CAPEX and OPEX proposals scale with the project size without tool-switching. The same workflow that closes a residential rooftop deal on a phone handles the complete document package for a 10 MW open access project in the same platform.
Q8. How long does it take to onboard a sales team to Reslink?
1 to 2 days to first customer-ready proposal. The interface is built for salespeople, not engineers, so non-technical field teams are productive within 48 hours. No prior engineering background is required to run the full design and proposal workflow. Most EPCs report their teams are generating independent proposals and closing on-site within the first two days of using the platform.
You May Also Like
- Best Solar Design Software in India for 2026
- Solar Proposal Software vs Manual Quotation: The India EPC Math
- How Reslink's 3D Solar Design Works: Site to Bankable Output
Sources
- MNRE - Approved Models and Manufacturers List (ALMM), current edition. mnre.gov.in
- PM Surya Ghar Muft Bijli Yojana - Subsidy notification and EPC guidelines. pmsuryaghar.gov.in
- CERC - Central Electricity Regulatory Commission, DISCOM interconnection standards. cercind.gov.in
- IEA - India solar energy market outlook. iea.org
Related Articles

Best PVsyst Alternative for Solar EPCs in 2026
PVsyst sets the simulation standard. Reslink adds mobile 3D design, automated BOE, SLD, ALMM compliance, and proposals. Full EPC workflow.

Best Aurora Solar Alternative for Solar EPCs in 2026
Looking for an Aurora Solar alternative? Reslink is solar design software built for India and emerging markets, not just the US. Here is why.
Best Arka360 Alternative for Solar EPCs in 2026
Looking for the best Arka360 alternative in 2026? Reslink offers mobile 3D design, automated BOM, bank-ready documents, CAPEX and OPEX proposals from one platform.